RedLines Scan
See what climate change could do to your sites
Every site scored against 11 physical climate hazards, today and under future scenarios. Know which assets are most exposed and what that could mean for repairs, insurance and capital plans.
From site list to prioritised results
- Provide your portfolioAsset locations and types, as a simple list or CSV.
- We run the standardised screeningEvery asset is assessed against every relevant hazard under IPCC-aligned scenarios.
- See where attention is neededReview the matrix, see which hazards drive exposure at each site, and decide where deeper analysis is justified.
Typical delivery: 48 hours from scoping.
Where exposure is highest across your portfolio, and what it could disrupt
- Screens every asset against 11 physical climate hazards, at site level rather than postcode
- Shows which assets are most exposed and which hazards are driving it, rated 0 to 5
- Compares today with future periods, so you can see whether exposure is rising before it reaches your repair bill or renewal
- Links elevated exposure to what it could mean on the ground: disruption, downtime, lost access, reduced productivity
- Stops short of pounds. Financial impact is what RedLines Pro adds on top
Traceable outputs you can stand behind
Climate screening without a documented method creates governance risk. RedLines Scan produces outputs you can stand behind.
Auditable
Every output references the data sources and assumptions behind each risk score.
Traceable
Risk scores can be traced back through the assessment process to the underlying climate data.
Defensible
Outputs are structured to support lender review, investor queries and governance challenge.
See which assets need attention
RedLines Scan shows where climate risk is highest across your portfolio, so you know which assets to look at more closely. It scores risk from 0 to 5 but does not estimate the financial impact; that is covered by RedLines Pro.
 Sample data
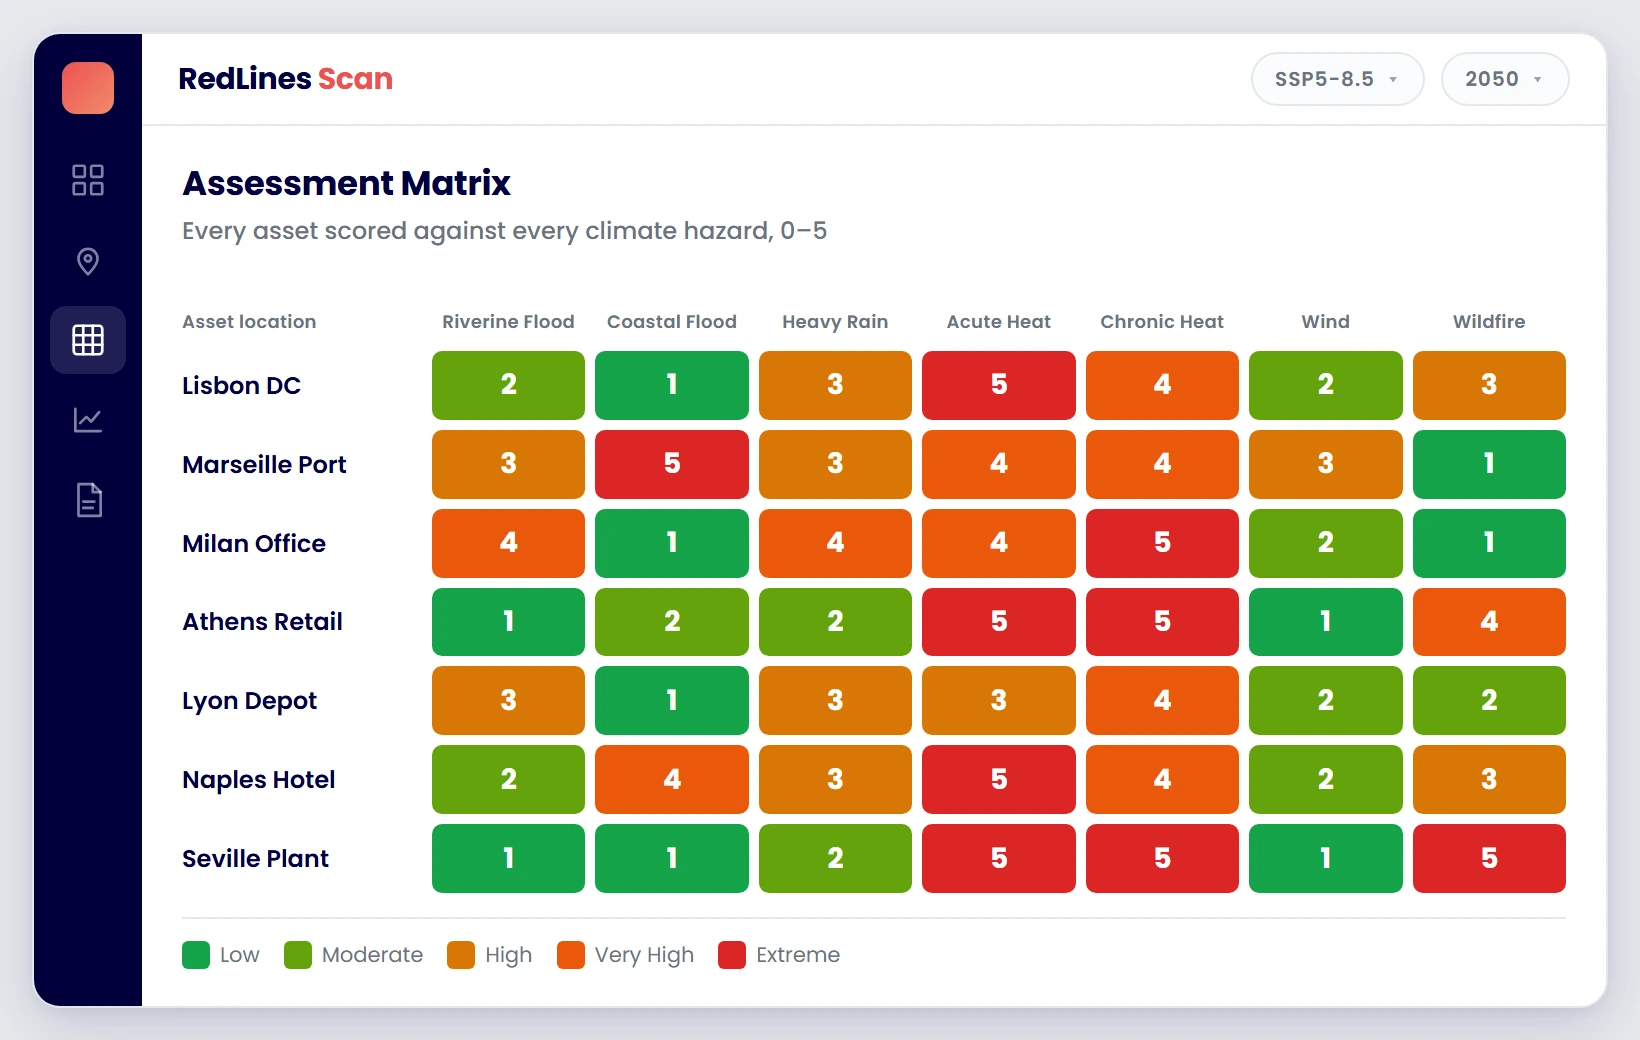
Every asset scored against every hazard
See which locations face the highest exposure and which hazards are driving it, so you know where attention is needed first.
 Sample data
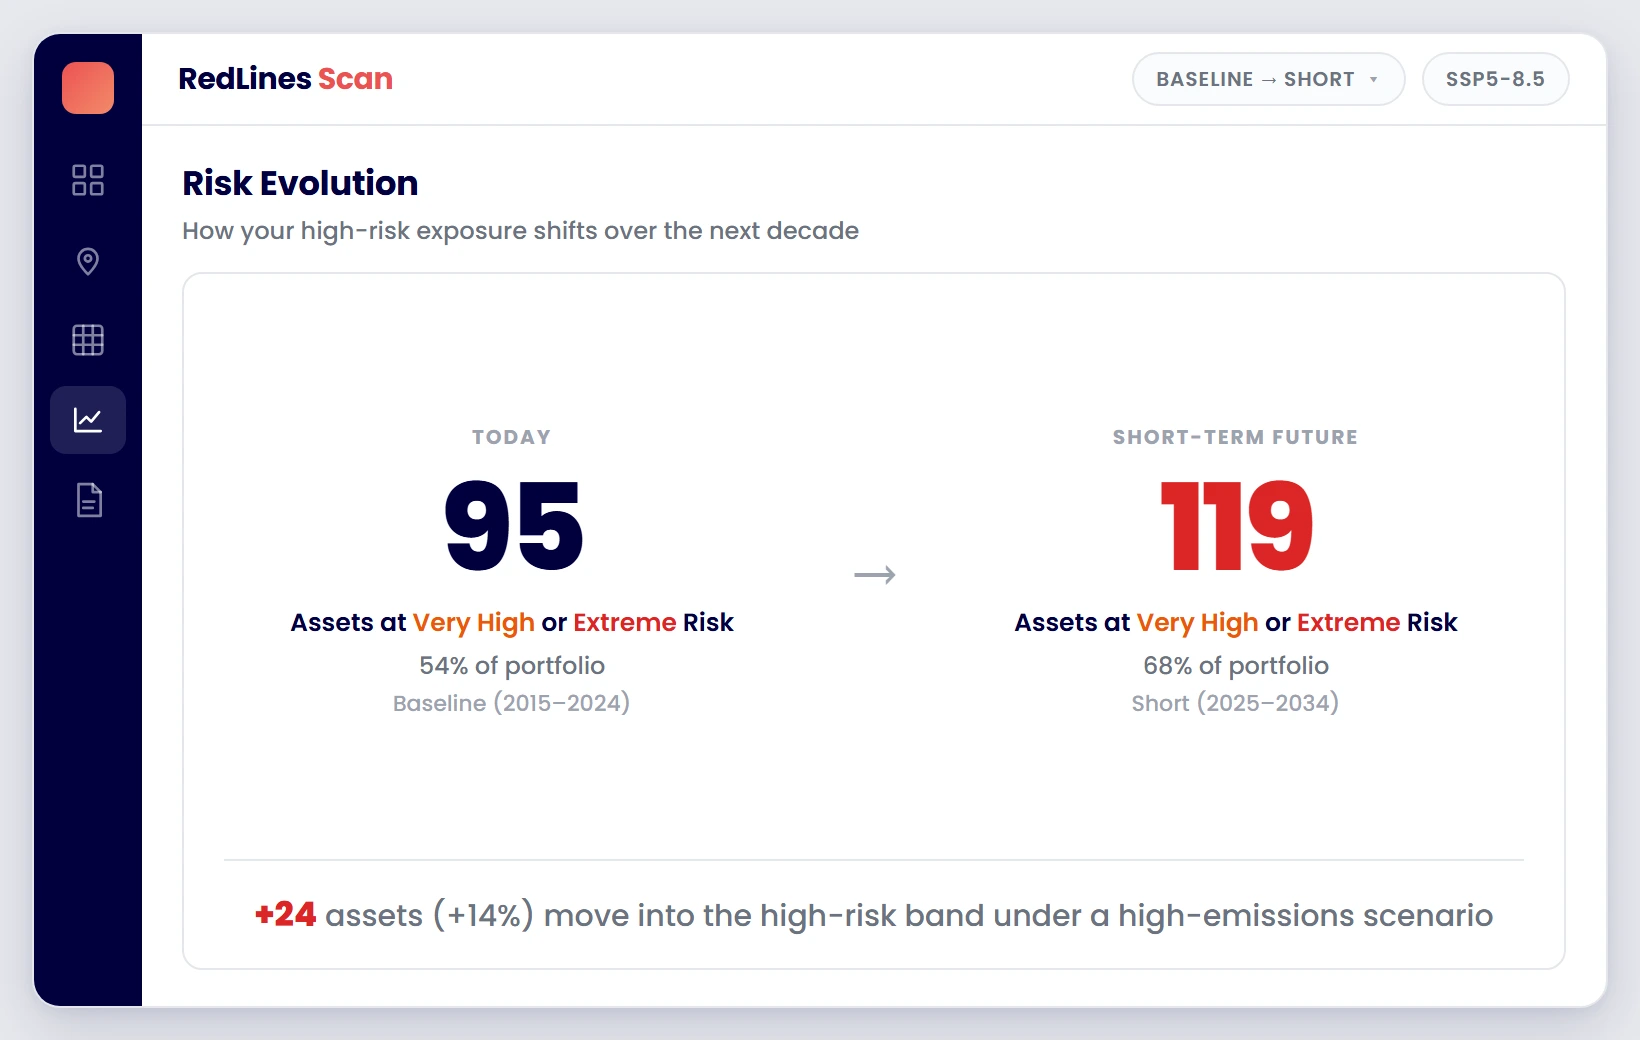
How exposure changes over time
Compare current and future periods to see whether risk is rising, stable or falling, and which scenarios are driving the change.
 Sample data
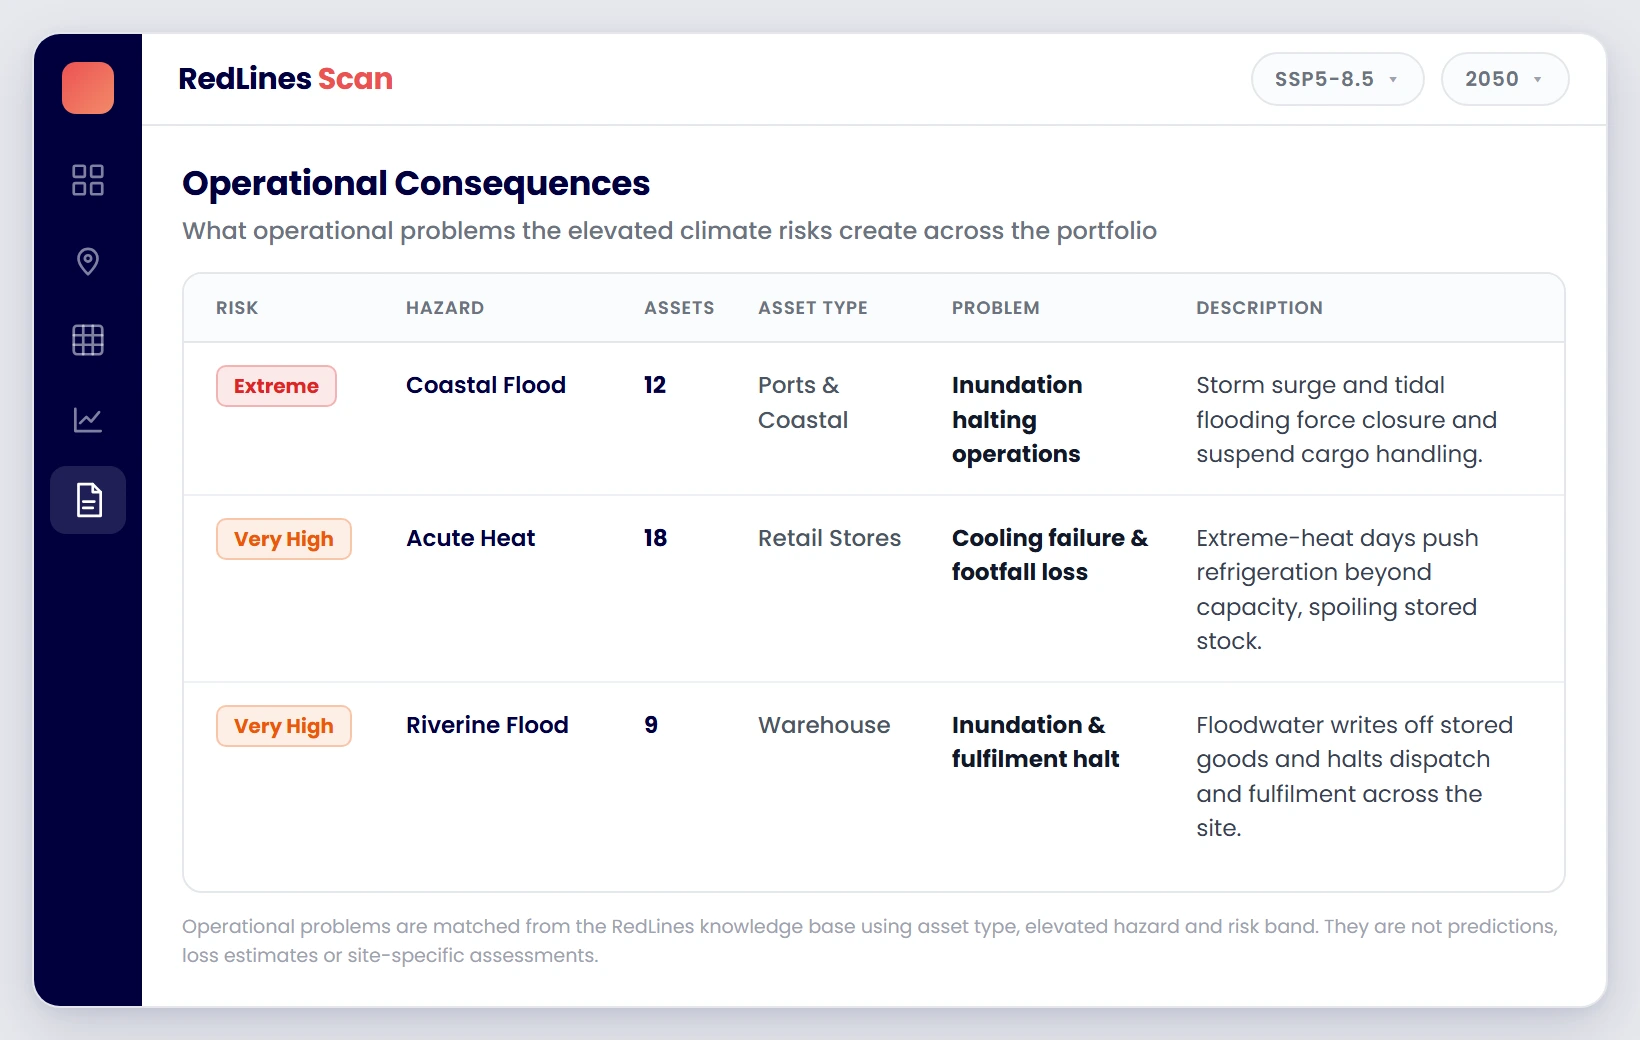
What elevated risk could mean operationally
Understand the potential business consequences of high and extreme exposure, from disruption and downtime to reduced productivity or site access.
Governed reports for the decision
RedLines results are accompanied by structured reports that document the assessment, assumptions and outputs for the decision they support.
Portfolio Exposure Assessment
Governed PDF Report
What a screening led to
Portfolios where RedLines Scan showed which sites needed closer analysis.
Food and Drink Supply Chain
Laithwaites
Every supplier vineyard screened on one method. Eight high-risk sites taken into RedLines Pro, informing a three-year supply diversification strategy.
Read case study ›Sport and Major Venues
The R&A
Full estate assessment across the UK and Ireland. Twelve priority sites identified for resilience investment, informing a ten-year capital plan.
Read case study ›Hospitality and Real Estate
International Hotel Group
Portfolio-wide assessment across five continents. Outputs structured for disclosure and passed external audit without modification.
Read case study ›Start free. Scale as decisions demand.
Ready to see your portfolio's climate exposure?