
RedLines Pro
A number you can defend, not just calculate
Financial exposure per asset and per scenario, traced from result to assumption to data source. Then what would fix it, what it costs and what it saves.
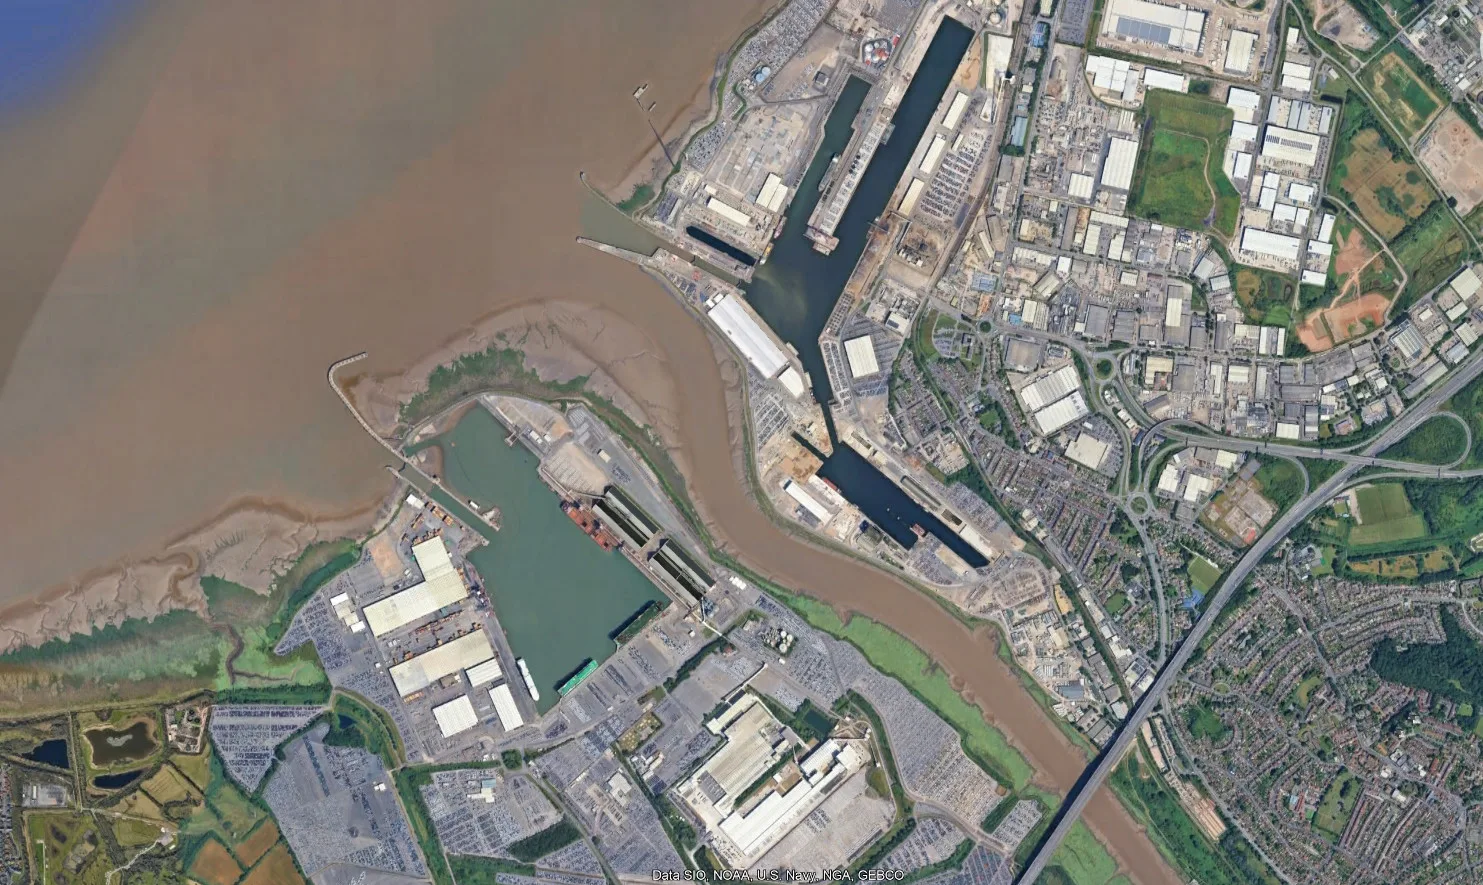
From inputs to a defensible number, and what to do about it
- Define the inputsThe asset base, cost drivers and time horizons the decision depends on.
- We quantify the riskPhysical and transition exposure translated into expected annual financial impact, per asset and per scenario.
- Review the implicationsAsset, supplier, portfolio and corporate views ready for capital, governance and operational decisions.
- Name the fix and its funding routeOptions that would reduce the exposure, each costed, with the residual risk after it. Where a funding or grant route applies to the measure, it is set out alongside the business case.
Typical delivery: 4-6 weeks from scoping
Built to survive the question: how did you get that number?
Every figure in RedLines Pro can be challenged and answered. The method is documented, the assumptions are visible and the data source is named.
Methodology governance
A documented, consistent analytical methodology applied across every assessment.
External scrutiny
Outputs structured for auditor review, investor query, lender due diligence and governance challenge.
Traceability
Every output can be traced from result to assumption to data source.
What the exposure costs, what would fix it, and whether the fix pays
- Puts a monetary value on physical and transition exposure, per asset and per scenario, across decades
- Models the fix: add an adaptation measure and its cost, and see the exposure it removes
- Builds the business case: cost of the measure against the loss it avoids, with the assumptions in view
- Ties every figure to its method, assumptions and data source, so it holds up under audit
- Delivered in the platform, with governed PDF reports when the board or lender needs the document
Costing the problem is half the job
RedLines Pro puts the fix next to the exposure, so the decision is made on evidence rather than on a bill.
- Adaptation options identified per asset and hazard, with the evidence behind each
- Each option costed, one-off or annual, and the exposure it removes shown as residual risk
- The business case: cost of the measure against the loss avoided, across scenarios and time horizons
- Funding and grant routes identified where they apply to the measure and the asset
- We identify options and model their effect. Engineering design stays with your engineers
Financial exposure, in the platform and on the record
RedLines Pro returns quantified analysis in the platform, with assumptions and inputs visible throughout.
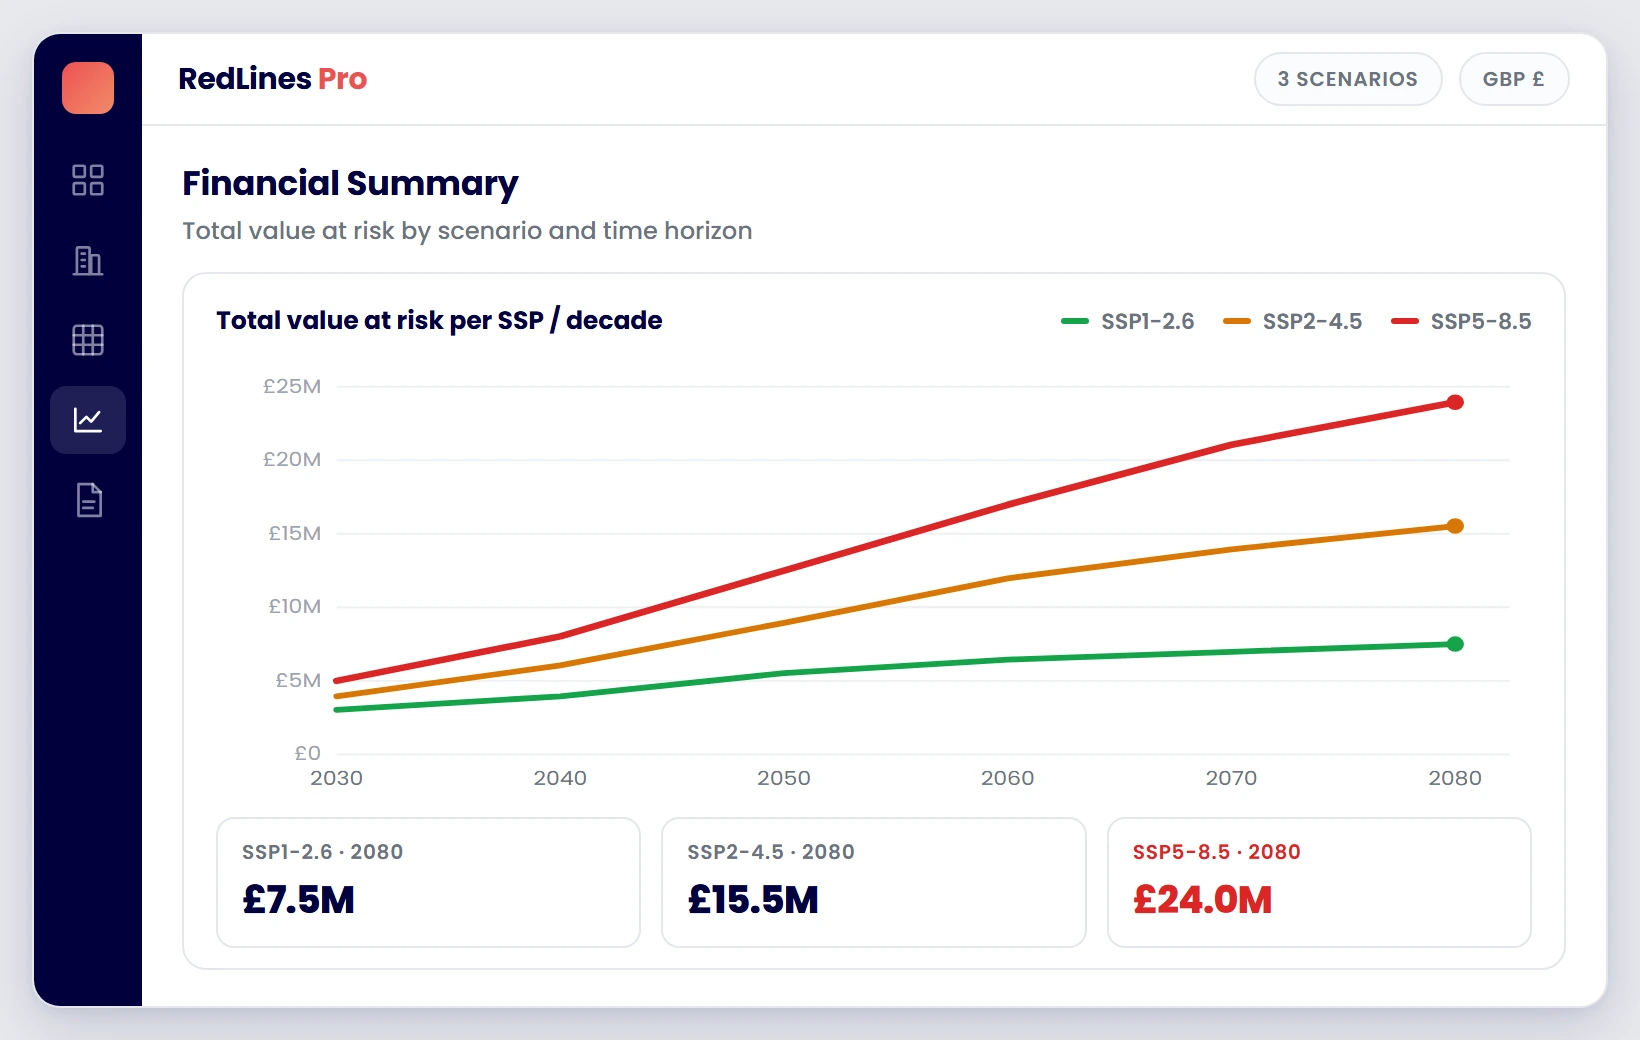 Sample data
Value at risk by scenario and horizon
The company-level financial summary: total value at risk for each climate scenario and each decade, in monetary terms.
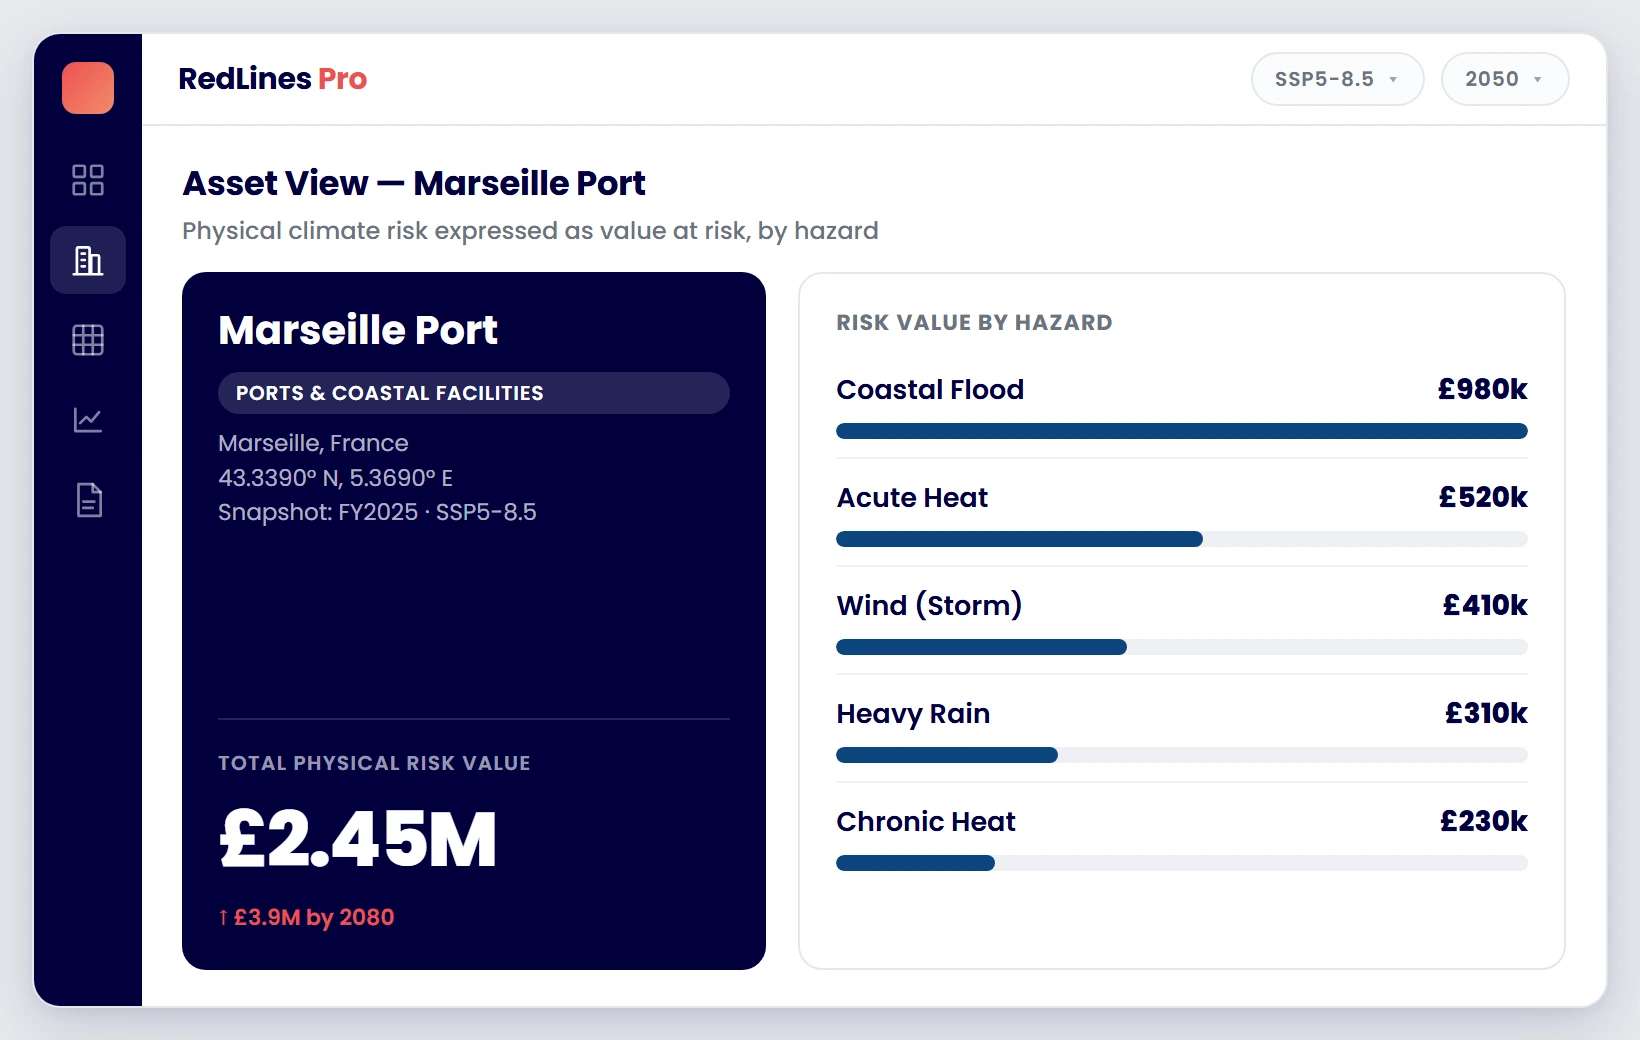 Sample data
Asset-level value at risk by hazard
Each asset's exposure expressed in monetary terms, broken down by the hazards driving it.
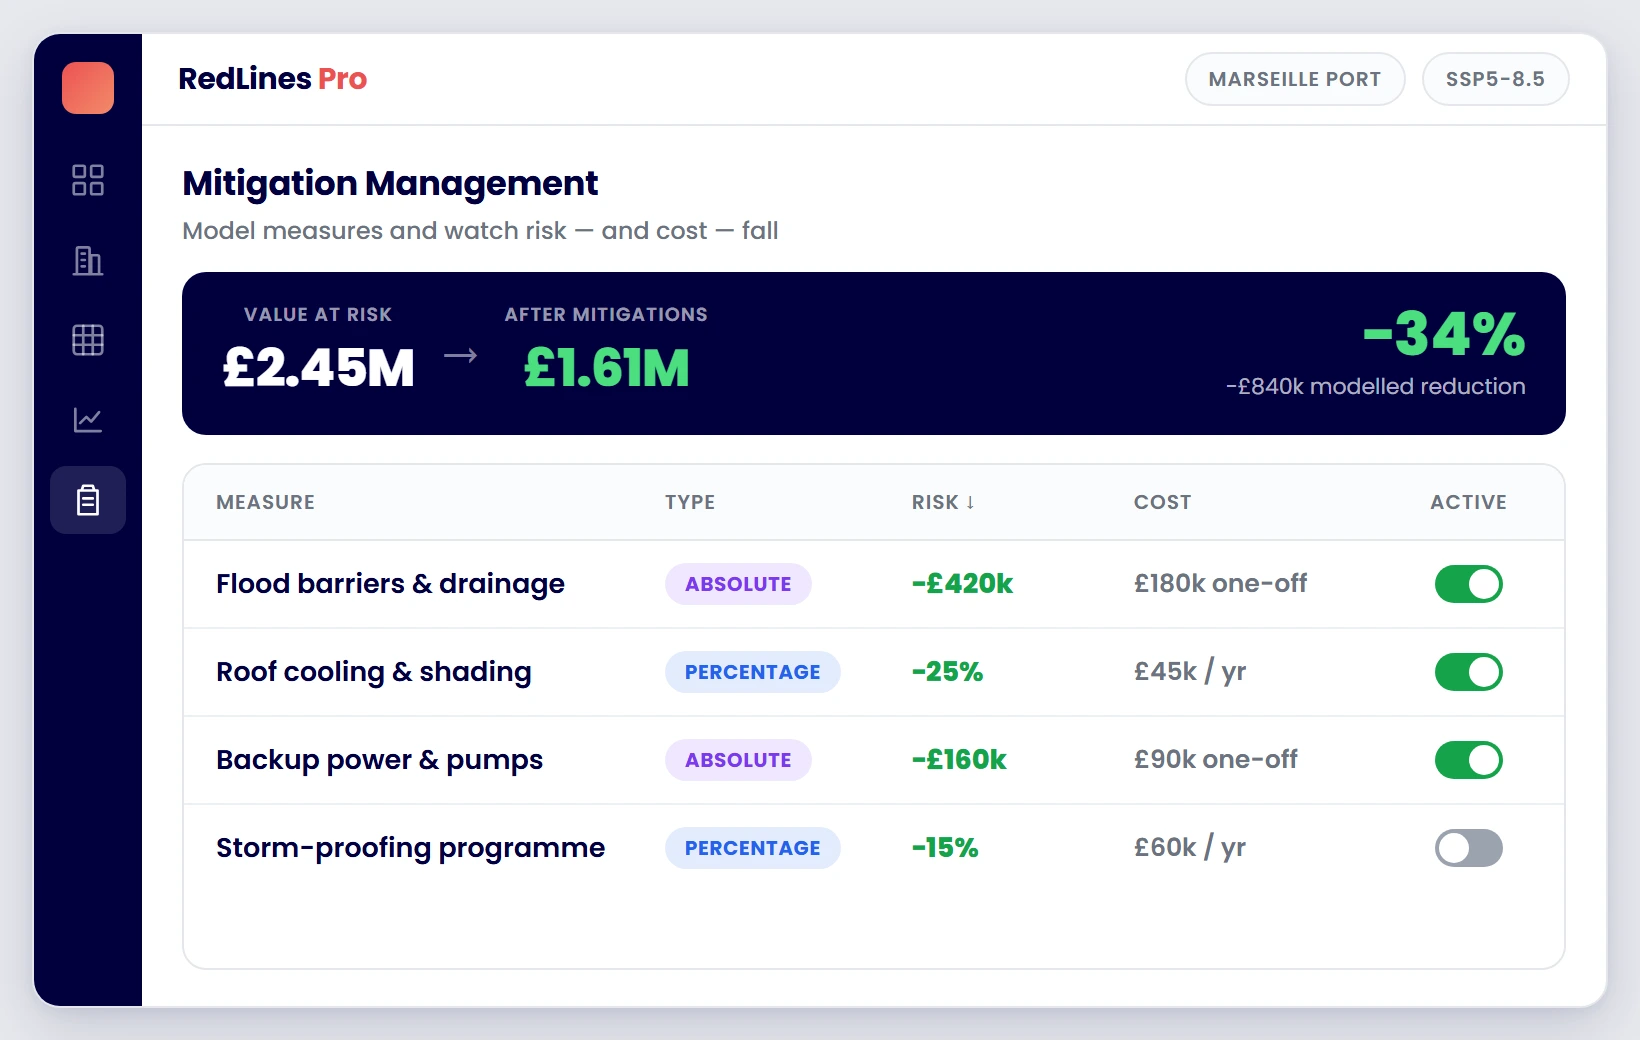 Sample data
The fix, costed, and the exposure it removes
Adaptation measures modelled against the asset with their cost, one-off or annual, and the value at risk before and after. This is the business case in one view.
Governed reports for the decision
RedLines results are accompanied by structured reports that document the assessment, assumptions and outputs for the decision they support.
Asset Climate Risk Report
Governed PDF Report
Supplier Climate Resilience Report
Governed PDF Report
Corporate Climate Risk Assessment
Governed PDF Report
Climate Cost Attribution Report
Governed PDF Report
Where the number changed the decision
Engagements where RedLines Pro quantified the exposure and the client acted on it.
Sport and Major Venues
The R&A
Estate-wide exposure quantified in four weeks. Twelve sites identified for resilience investment; the outputs shaped the ten-year estate strategy and capital allocation framework.
Read case study ›Hospitality and Real Estate
International Hotel Group
Portfolio assessed and prioritised in three weeks. Fifteen high-risk properties identified for adaptation planning; the disclosure report passed external audit without modification.
Read case study ›Food and Drink Supply Chain
Mondelez
Climate-related cost exposure quantified across the ingredient supply base, giving leaders a repeatable view of which sourcing regions need closer monitoring.
Read case study ›Start free. Scale as decisions demand.
Ready to put a defensible number on your exposure? Discuss your decision with our team.