
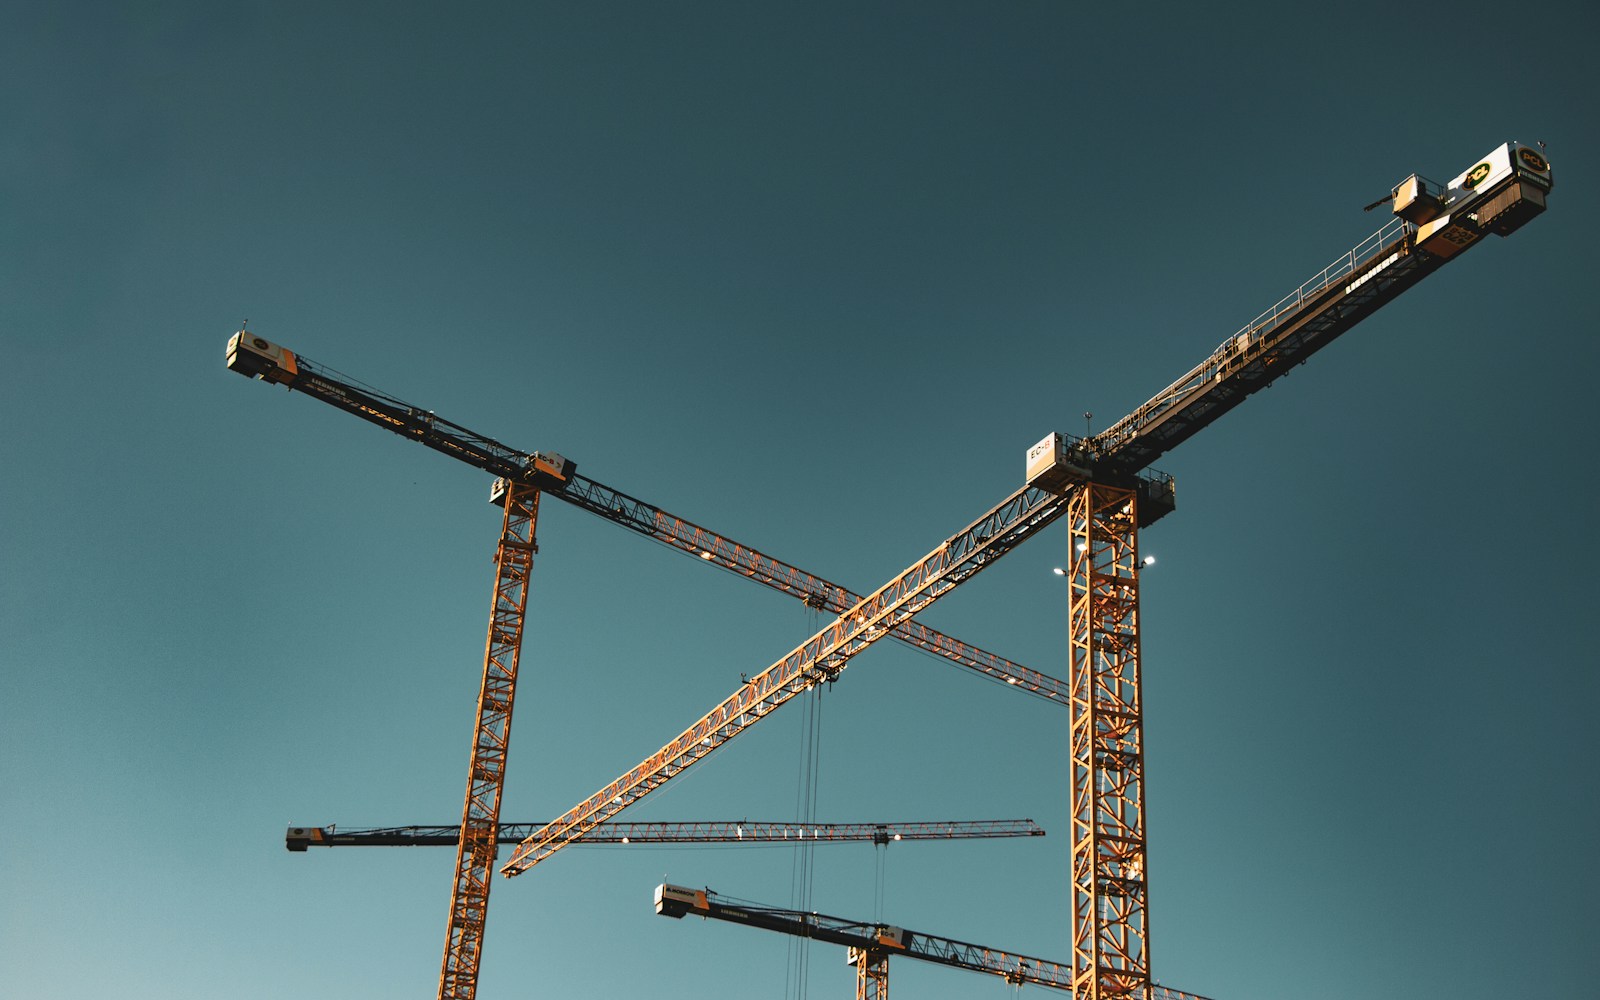
A leading UK construction firm
A current project connecting climate hazards to construction activities, with regional exposure expressed in working days lost.
- 6
- operating regions in scope
One quantified view of climate exposure across the assets, operations and suppliers that matter, built so a board can act on it and an auditor can check it.

Expected annual cost across the assessed business, by climate scenario and time horizon, with the assumptions behind the estimates set out for review.
RedLines Pro
Explore the assets and risks contributing to the company total, with the sources and assumptions behind the results available for review.

Our team uses and configures RedLines Pro for your assessment. You receive a dashboard with downloads for the data file, report, audit summary and executive slide deck.
A current project connecting climate hazards to construction activities, with regional exposure expressed in working days lost.
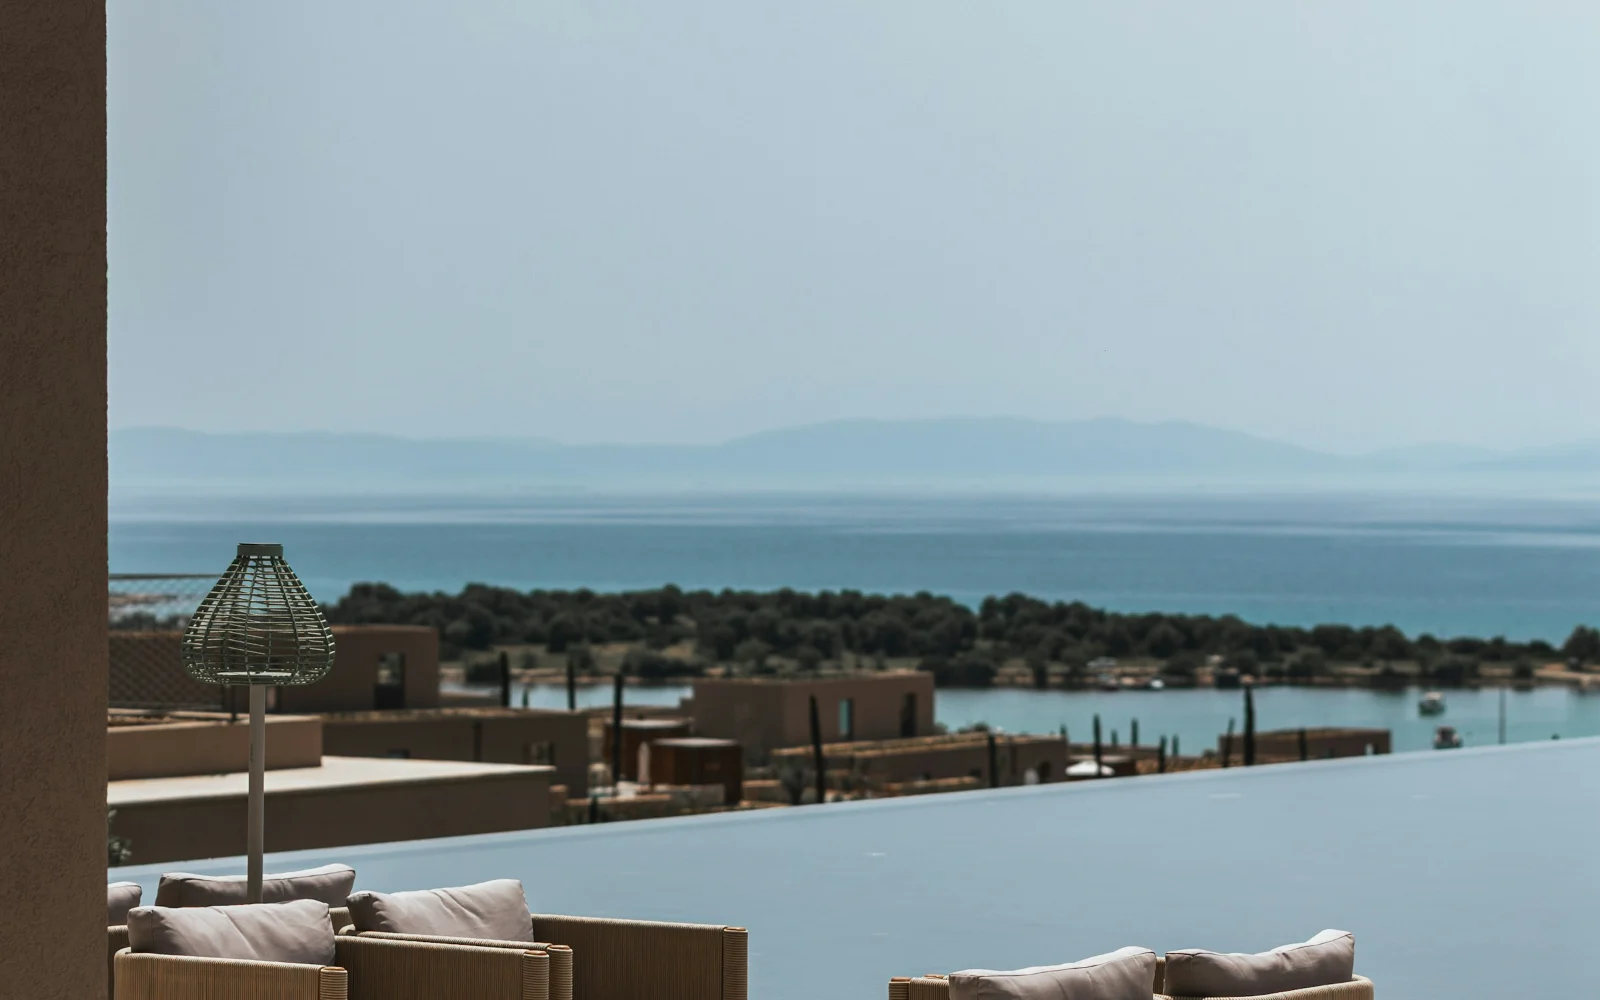
Across 44 Adriatic hotel and resort sites, the assessment found that changes in the cost of flying could outweigh physical climate damage. Results were expressed as a share of turnover.
Tell us the decision or the disclosure the evidence has to support, and we will scope the assessment to it.
A free screening provides portfolio summaries that help you decide where closer investigation is needed. RedLines Pro estimates expected annual cost by asset, scenario and time horizon.