
Decision Use Case
Which assets are at risk?
Portfolio Exposure
A rapid portfolio-level view of climate exposure across your assets. See where risk is concentrated before committing capital, reviewing insurance or engaging lenders.
Climate risk is not spread evenly across your portfolio
Large estates need a consistent, defensible view of which sites carry the highest exposure.
Portfolio and asset leaders
For real estate teams, infrastructure operators and asset owners managing multiple sites who need to know where climate exposure is highest.
Capital, insurance and resilience planning
Capital allocation, disposals, insurance readiness and lender confidence all depend on knowing where risk is material.
Generic tools do not create a clear portfolio view
Most tools give a score. Few create defensible evidence senior teams can use to prioritise action.
Postcode scores miss asset reality
Off-the-shelf tools report risk at postcode level. Nearby assets can receive the same score despite very different exposure.
One-off reports are hard to refresh
Consultancy-led screening gives a point-in-time view. When the portfolio changes, results are hard to update or compare.
Traffic lights rarely drive action
Simple RAG summaries may flag concern, but often lack the structure needed for board, lender or insurer discussion.
Every site scored, the exposed ones surfaced, in days not months
A clear portfolio output for asset teams, boards, insurers and lenders: repeatable, traceable and built for decisions.
- Asset-level climate risk scores across key physical hazards
- Clear prioritisation of high-exposure assets for deeper analysis
- Hazard breakdown by site showing which risks matter where
- Concise output for board, lender, insurance and governance conversations
The matrix that shows where to look first
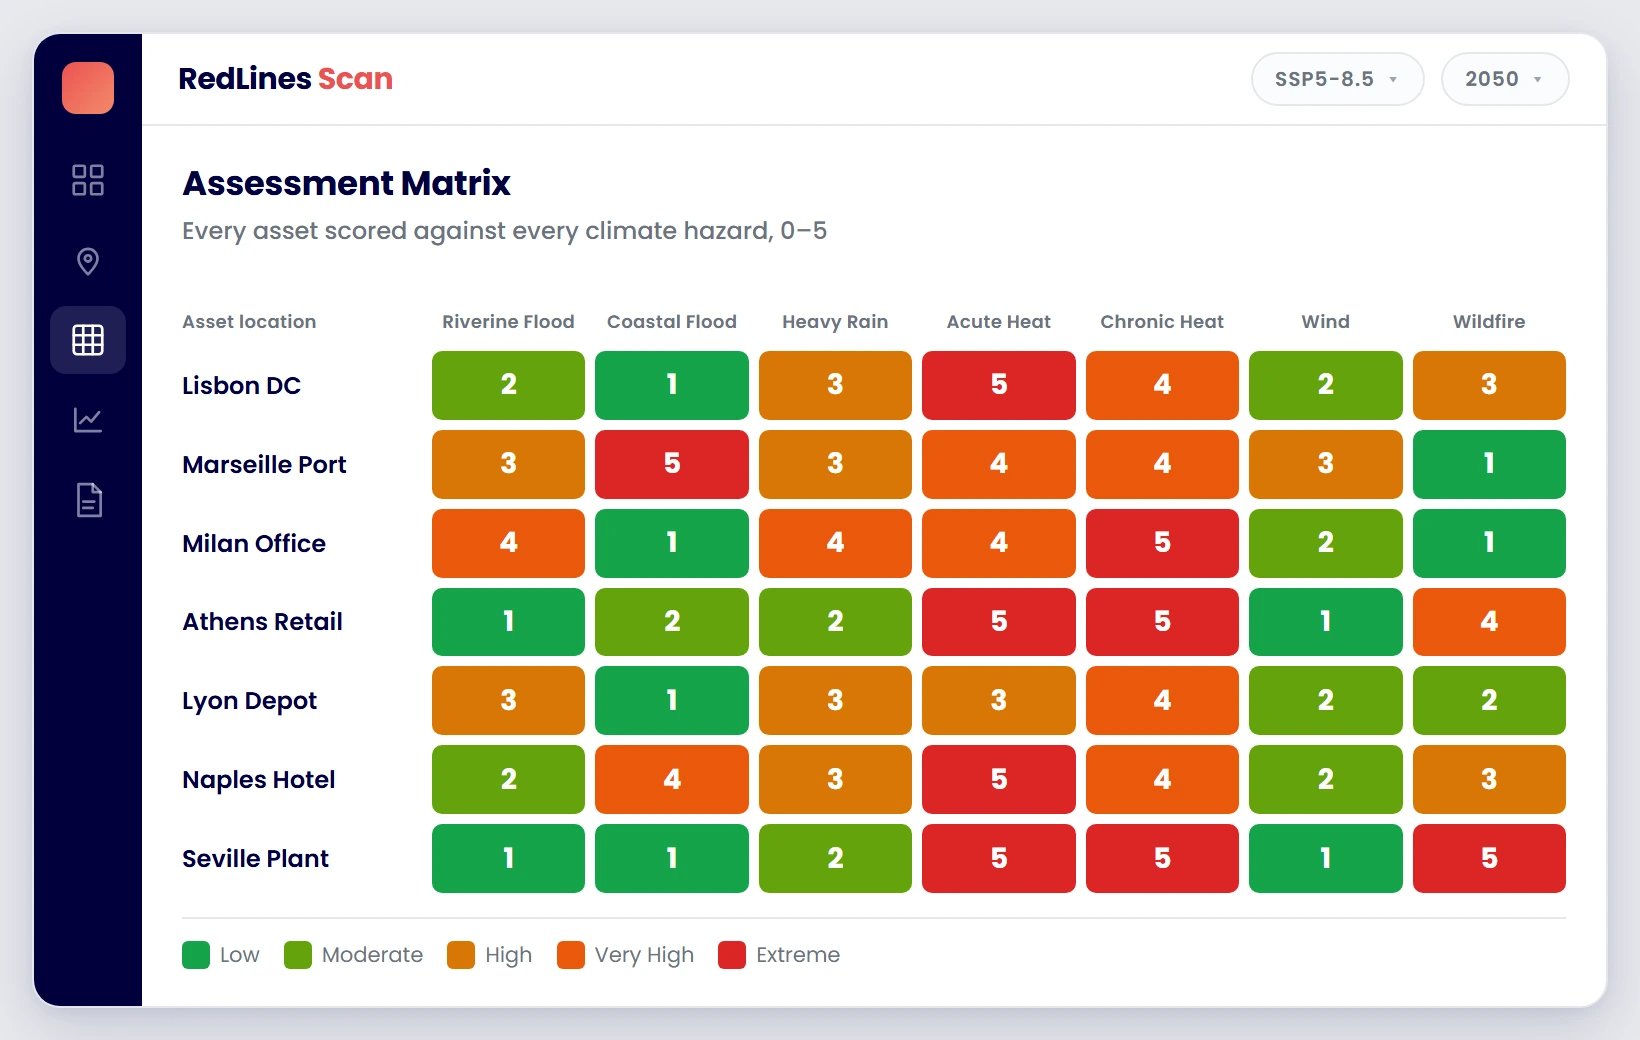
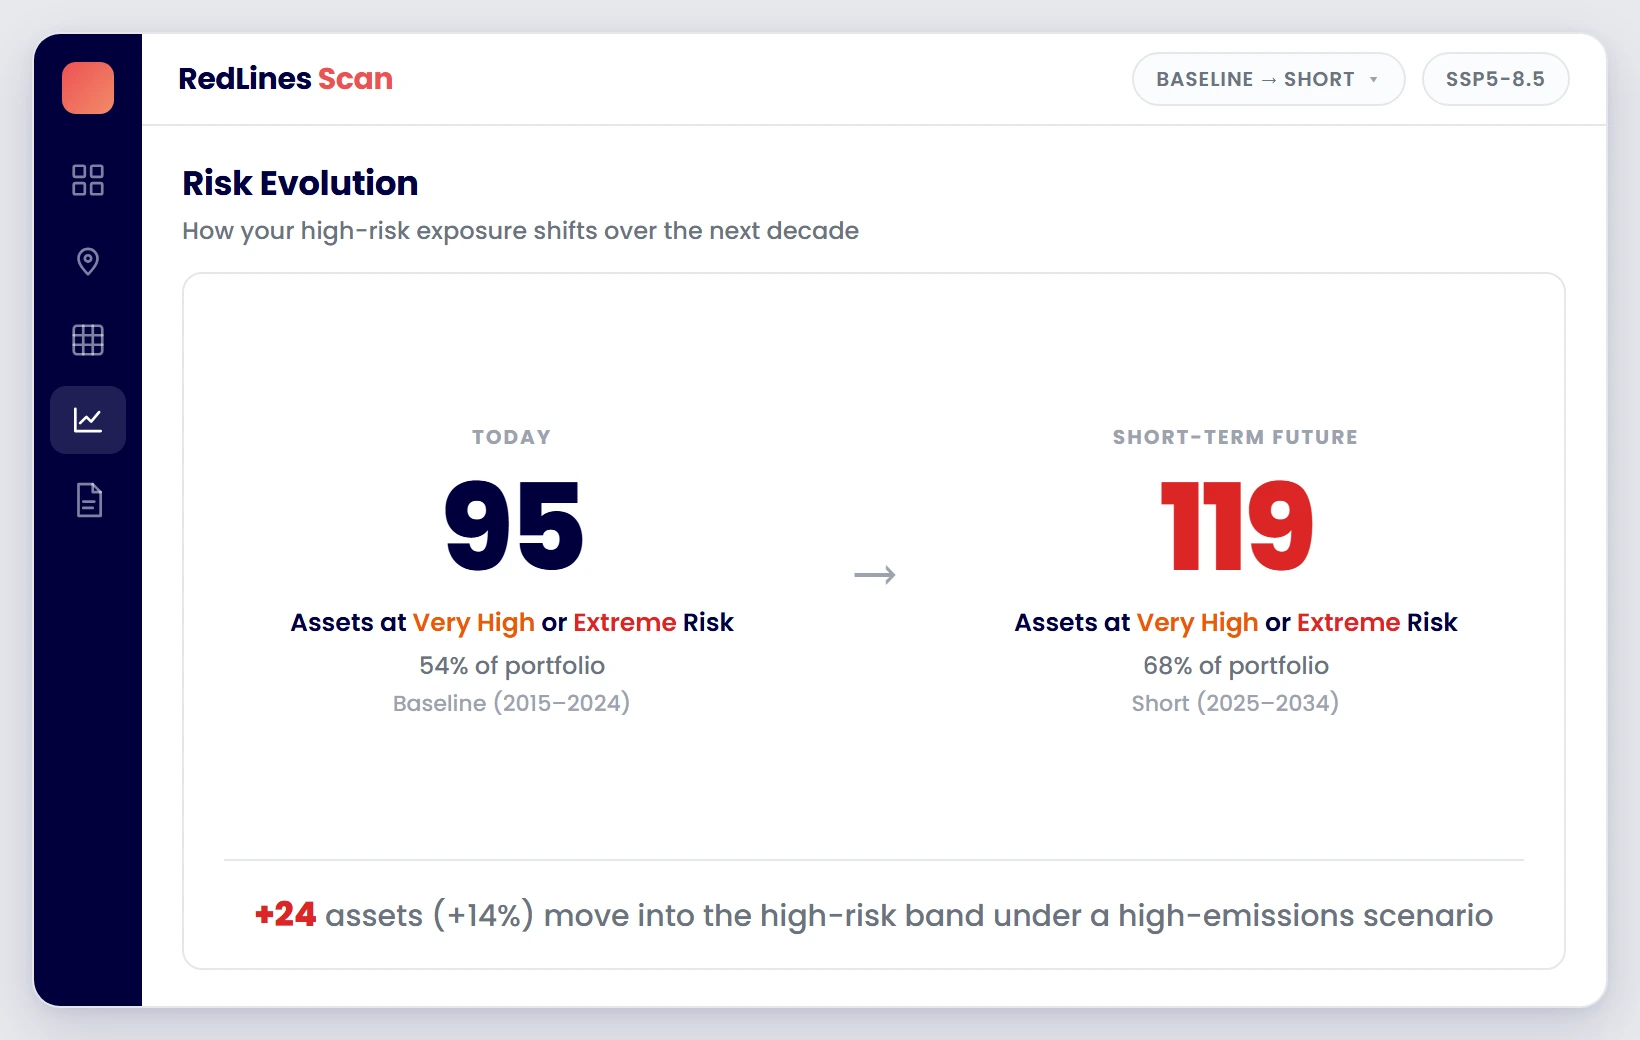
Every asset against every hazard, rated 0 to 5, then how that picture changes over time.
 Sample data
Every asset scored against every hazard
See which locations face the highest exposure and which hazards are driving it, so you know where attention is needed first.
 Sample data
How exposure changes over time
Compare current and future periods to see whether risk is rising, stable or falling across the portfolio.
In practice: The R&A had 30+ venues across the UK and Ireland assessed on one method in four weeks; twelve were identified for resilience investment and the outputs shaped a ten-year capital plan. Read the case study ›
Portfolio Exposure Assessment
A concise PDF report covering every asset in the assessed portfolio. Delivered as a board-ready output with consistent methodology across all sites.
- Consistent physical hazard methodology applied to every asset
- Traceable outputs referencing climate data sources and scenario assumptions
- Structured for board discussion, lender review and insurance engagement
Portfolio Exposure Assessment
Governed PDF Report
Relevant Sectors
Start free. Scale as decisions demand.
Want to see where climate risk sits across your portfolio?